MY ROLE
Visual Design, UX Research
TIMELINE
2018
Challenge
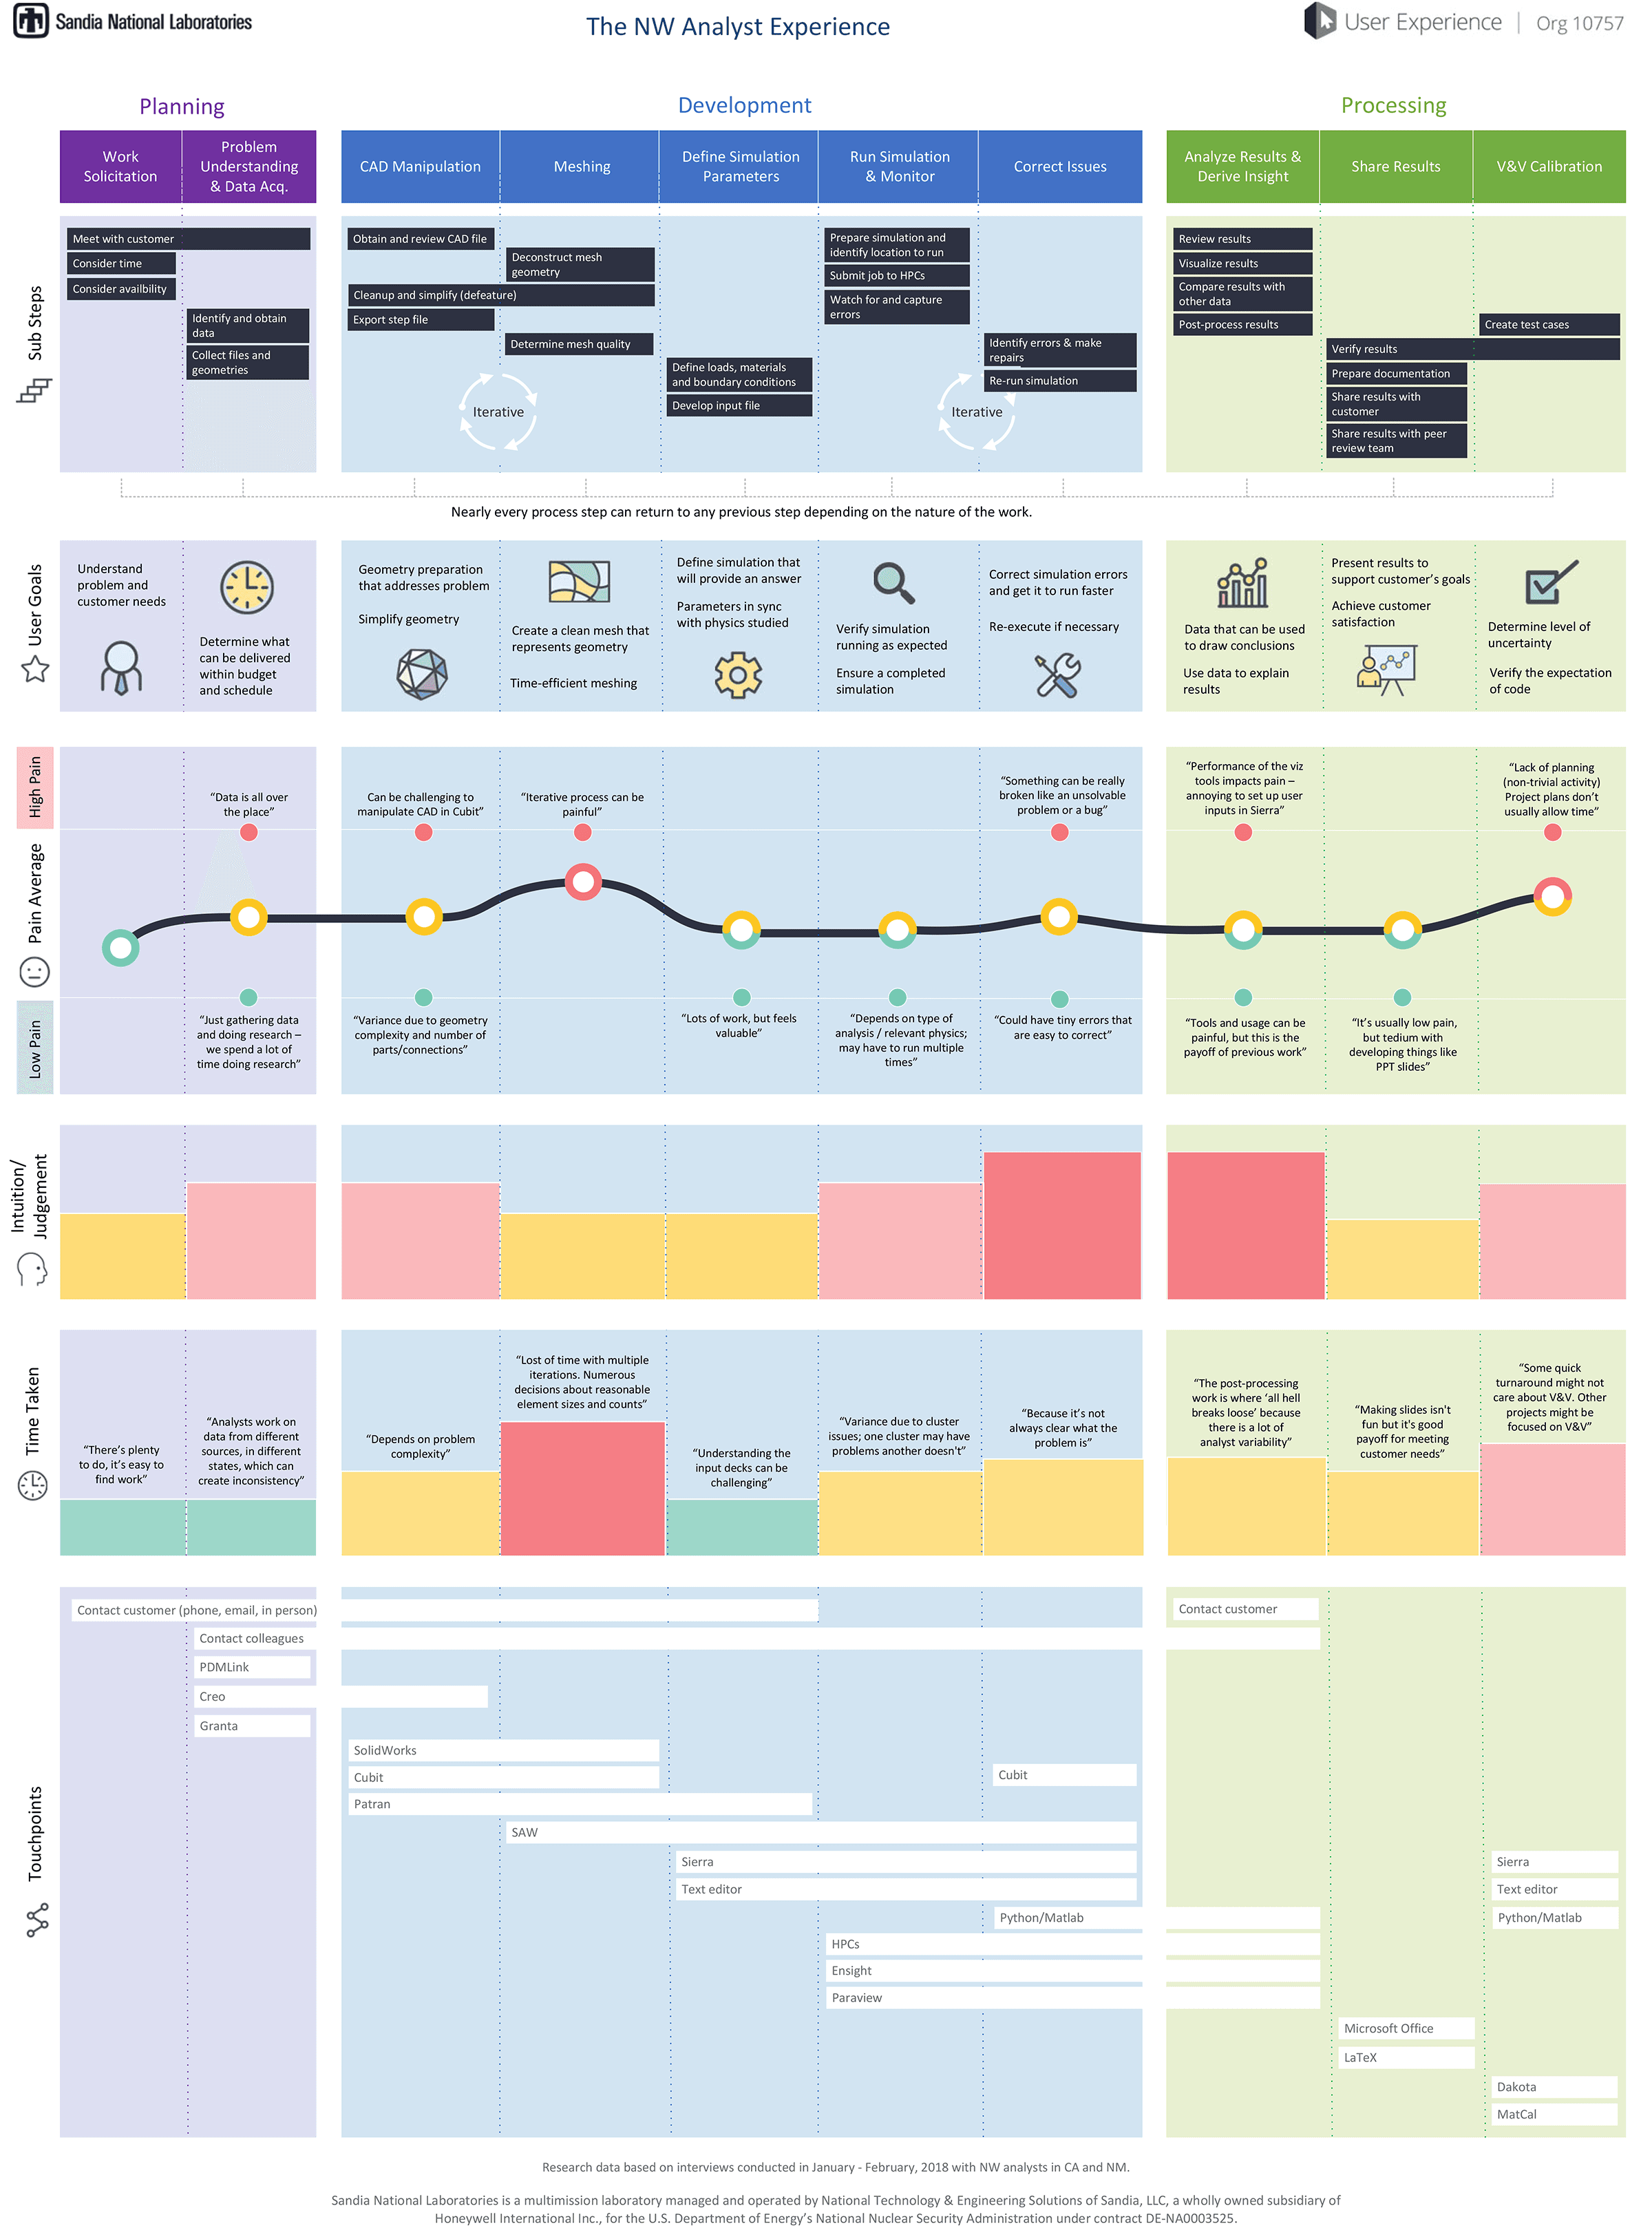
As part of the design for a new modeling and simulation application, UX researchers reached out to potential users of the system to collect information about their current experience in the space. The researchers needed to tell a visual story of the data that was collected for it to be impactful.
Design
The data was given to me in a raw Excel format.
First, I organized similar data points into categories that would become the horizontal swim lanes (e.g. User Goals) in the journey map.
I analyzed the data, looking for patterns, and extracted out salient data points that expressed each of the categories.
These were then mapped to the linear steps of the current process (e.g. Planning).
I met with the researchers to review my groupings and once this was refined, I designed a journey map that reflected the data and the patterns that had been identified.

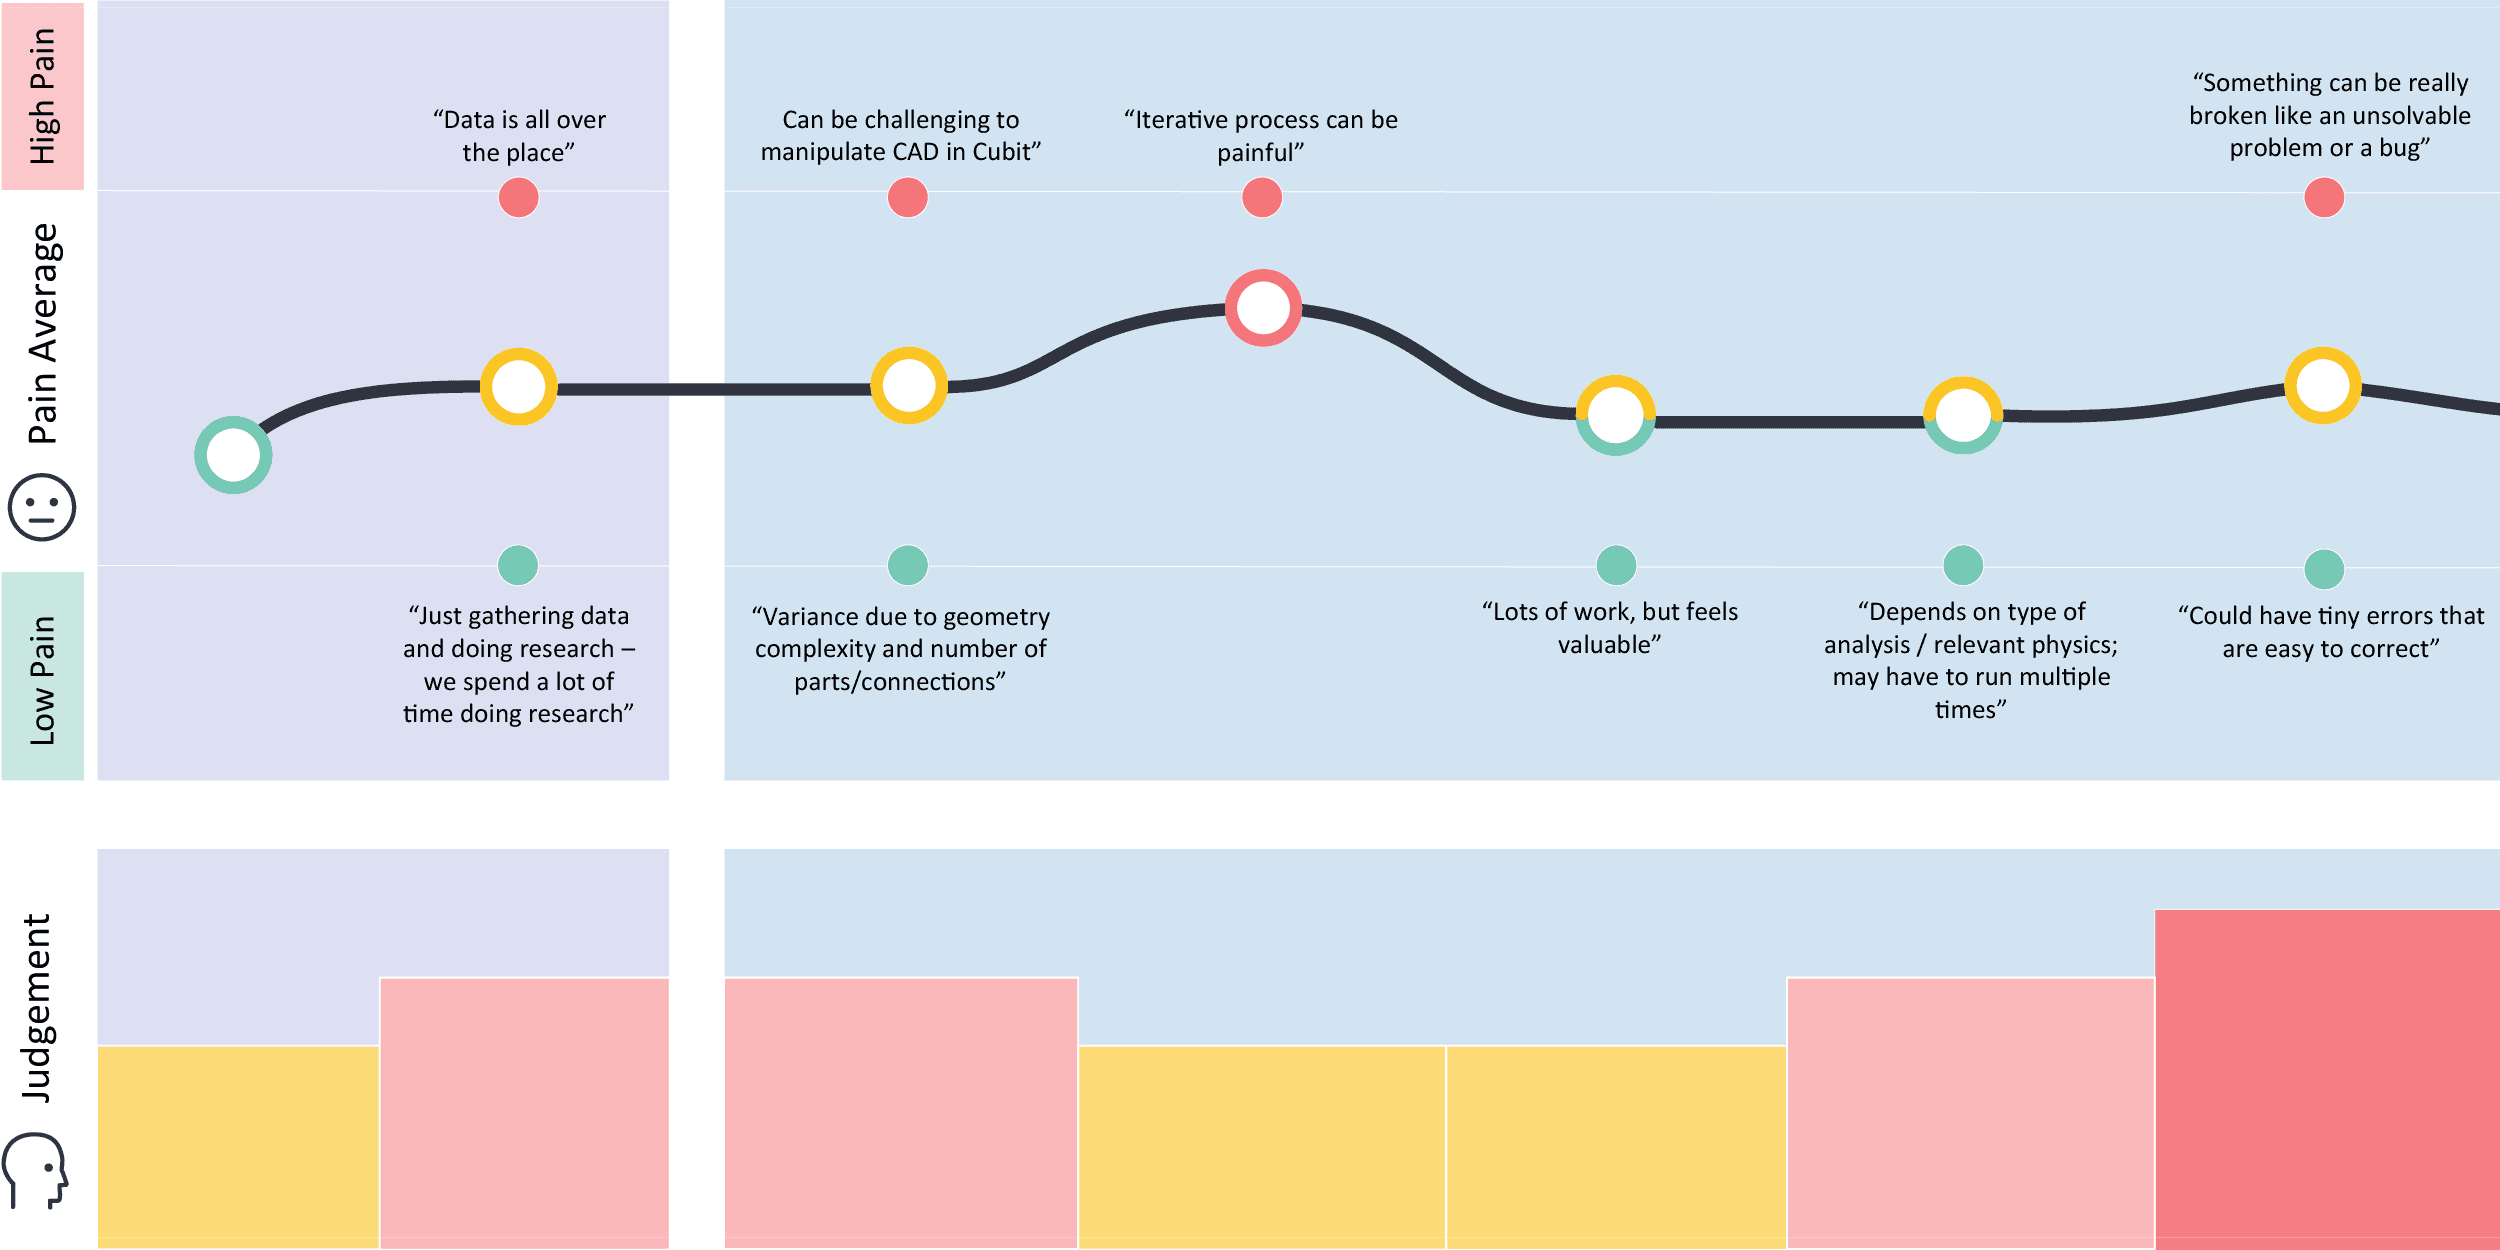
Above: Customer journey map of the Nuclear Weapons Analyst user type.
